Visualisation definition Scorecard
The scorecard chart visualisation type represents data as a scorecard.
A scorecard is used to display:
- The value of a data point at a specific point in time.
- The data trend over time, within a user selected date range.
- The RAG score/status for the presented value.
contents
When to use
Use this visualisation type when:
- you need to display data as a single scorecard.
- you need to display a single column value as a scorecard
When not to use
If you want to display a group of scorecards using a single visualisaton definition you should use Scorecard group
Use Scorecard group when:
- You have multiple rows in your visualisation dataset
- You want to display a group of scorecards
How it works
Value
The metric value and description is taken from the value in the single measure column provided in the definition
If timestamp data is present in the data, the value is taken from the latest data in the dataset
Score
The data score is represented as a colour to denote its status.
See Data Scoring & Bucketing for docs on how data is scored and bucketed, and how to define custom buckets.
If not data score or custom bucketing is found then the data score is not displayed.
Trend
The trend data for the metric value is derived from the difference between the earliest and latest value in the dataset.
If no timestamp data is found then the trend is not displayed
Definition
{
  id: 'scorecard-definition-example',
  type: 'scorecard',
  display: 'The description displayed in the scorecard',
  description: 'scorecard visualisation description',
  option: {
    ...
  }
  column: {
    key: [ ... ],
    measure: [{ id: 'column-id' }]  // Always expects only a single measure
  }
}
See the Targeting data for and how to target data with the column
Options:
See Custom buckets for options documentation
Data assumptions
- To display trend data, a column with an ID of
tsmust be present in the parent data
Examples
- Simple scorecard
- Scorecard section
- Simple scorecard with filter
- Scorecard with filter for alternate dataset
- RAG Scores
- Custom bucket colours
- Custom buckets
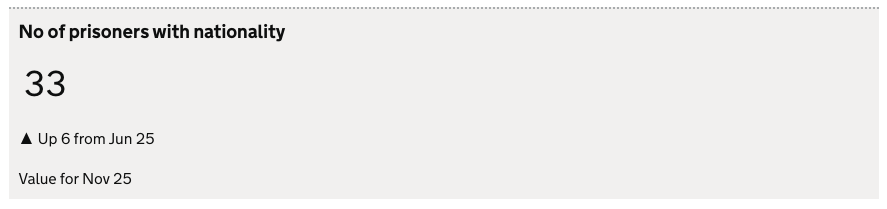
Simple scorecard
This exmaple demonstrates how to define a scorecard in its simplest form.
Dataset
| ts         | est_id | has_metric_two  | metric_two_is_missing  | has_metric_three | metric_three_is_missing |
|------------|--------|-----------------|------------------------|------------------|-------------------------|
| Jun 25.    | ABC    | 74              | 485                    | 300              | 500                     |
| Jul 25.    | ABC    | 80              | 701                    | 280              | 320                     |
| Aug 25.    | ABC    | 56              | 725                    | 220              | 214                     |
| Sep 25     | ABC    | 30              | 765                    | 220              | 214                     |
| Oct 25.    | ABC    | 42              | 765                    | 220              | 214                     |
| Nov 25.    | ABC    | 21              | 765                    | 220              | 214                     |
Definition
{
  id: 'simple-scorecard',
  type: 'scorecard',
  display: 'No of prisoners with MetricTwo',
  description: 'Example definition description',
  column: {
    key: [{ id: 'est_id' }],
    measure: [{ id: 'has_metric_two' }],
  },
}
Visualisation
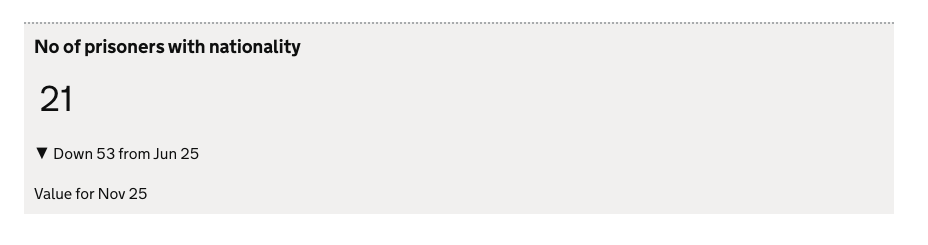
Simple scorecard with filter
The example demonstrates how to a define scorecard that get its value by using the filter field
- If the filter return no rows then the scorecard is not displayed.
Dataset
| ts         | est_id | has_metric_two | has_metric_three |
|------------|--------|----------------|------------------|
| Jun 25.    | ABC    | 21             | 485              |
| Jun 25.    | DEF    | 27             | 485              |
| Jul 25.    | ABC    | 80             | 701              |
| Jul 25.    | DEF    | 84             | 701              |
| Aug 25.    | ABC    | 56             | 725              |
| Aug 25.    | DEF    | 34             | 725              |
| Sep 25     | ABC    | 30             | 765              |
| Sep 25     | DEF    | 36             | 765              |
| Oct 25.    | ABC    | 42             | 765              |
| Oct 25.    | DEF    | 44             | 765              |
| Nov 25.    | ABC    | 12             | 765              |
| Nov 25.    | DEF    | 33             | 765              |
Definition
{
  id: 'simple-scorecard',
  type: 'scorecard',
  display: 'No of prisoners with MetricTwo',
  description: 'Example definition description',
  column: {
    key: [{ id: 'est_id' }],
    measure: [{ id: 'has_metric_two' }],
    filter: [
      {
        id: 'est_id',
        equals: 'GHI'
      }
    ],
  },
}
Visualisation
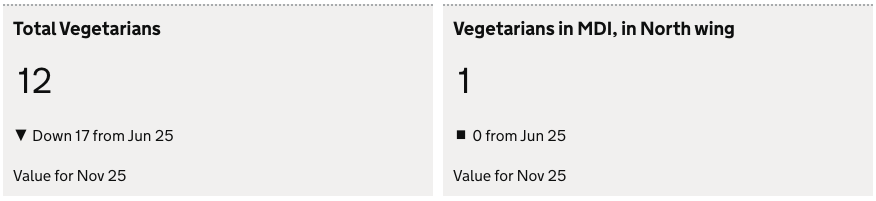
Scorecard with filter for alternate dataset
Dataset
| ts         | est_id | wing     | diet       | total  |
|------------|--------|----------|------------|--------|
| Nov 25.    |        |          |            | 30     |
| Nov 25.    |        |          | Diet one   | 12     |
| Nov 25.    |        |          | Diet three | 8      |
| Nov 25.    |        |          | Diet four  | 10     |
| Nov 25.    |  ABC   |          |            | 30     |
| Nov 25.    |  ABC   | north    |            | 15     |
| Nov 25.    |  ABC   | south    |            | 15     |
| Nov 25.    |  ABC   | north    | Diet one   | 1      |
| Nov 25.    |  ABC   | north    | Diet three | 5      |
| Nov 25.    |  ABC   | north    | Diet four  | 9      |
| Nov 25.    |  ABC   | south    | Diet one   | 11     |
| Nov 25.    |  ABC   | south    | Diet three | 3      |
| Nov 25.    |  ABC   | south    | Diet four  | 1      |
... omitted past ts rows.
Definition
{
  id: 'section-2',
  display: 'Diet totals',
  description: '',
  visualisation: [
    {
      id: 'sc-diet-totals',
      type: 'scorecard',
      display: 'Total Diet ones',
      column: {
        key: [],
        measure: [{ id: 'count' }],
        filter: [
          {
            id: 'diet',
            equals: 'Diet one',
          },
        ],
        expectNull: true,
      },
    },
    {
      id: 'sc-diet-totals-by-wing',
      type: 'scorecard',
      display: 'Diet ones in ABC, in North wing',
      column: {
        key: [{ id: 'establishment_id' }, { id: 'wing' }],
        measure: [{ id: 'count' }],
        filter: [
          {
            id: 'diet',
            equals: 'Diet one',
          },
          {
            id: 'establishment_id',
            equals: 'ABC',
          },
          {
            id: 'wing',
            equals: 'north',
          },
        ],
        expectNull: true,
      },
    }
  ],
}
Visualisation
Scorecard section
Defining multiple scorecard visualisation types adjacent to each other within a section will create a scorecard group.
Dataset
| ts         | est_id | has_metric_two | has_metric_three | has_metric_one |
|------------|--------|----------------|------------------|----------------|
| Jun 25.    | ABC    | 81             | 89               | 36             |
| Jul 25.    | ABC    | 80             | 34               | 80             |
| Aug 25.    | ABC    | 56             | 67               | 30             |
| Sep 25     | ABC    | 30             | 56               | 67             |
| Oct 25.    | ABC    | 42             | 43               | 42             |
| Nov 25.    | ABC    | 94             | 61               | 51             |
Definition
{
  id: 'section-2',
  display: 'Data quality scorecards with RAG colours',
  description: '',
  visualisation: [
    {
      id: 'simple-scorecard-MetricTwo',
      type: 'scorecard',
      display: 'No of prisoners with MetricTwo',
      column: {
        key: [{ id: 'est_id' }],
        measure: [{ id: 'has_metric_two' }],
      },
    },
    {
      id: 'simple-scorecard-MetricOne',
      type: 'scorecard',
      display: 'No of prisoners with MetricOne',
      column: {
        key: [{ id: 'est_id' }],
        measure: [{ id: 'has_metric_one' }],
      },
    },
    {
      id: 'simple-scorecard-MetricThree',
      type: 'scorecard',
      display: 'No of prisoners with MetricThree',
      column: {
        key: [{ id: 'est_id' }],
        measure: [{ id: 'has_metric_three' }],
      },
    },
  ],
}
see here for more info on targeting data
Visualisation

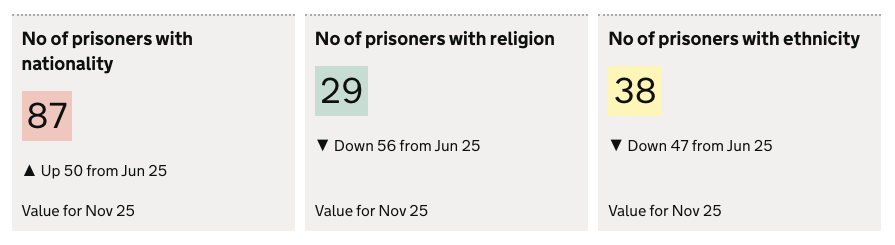
RAG Scores
This examples display RAG scores within the scorecard:
- defines
useRagColour: trueto enable RAG colouring. - Assumes that the dataset contains a rag score through a scoring engine.
Dataset
| ts         | est_id | has_metric_two | has_metric_three | has_metric_one |
|------------|--------|----------------|------------------|----------------|
| Jun 25.    | ABC    | 37             | 85               | 75             |
| Jul 25.    | ABC    | 80             | 34               | 80             |
| Aug 25.    | ABC    | 56             | 67               | 30             |
| Sep 25     | ABC    | 30             | 56               | 67             |
| Oct 25.    | ABC    | 42             | 43               | 42             |
| Nov 25.    | ABC    | 87             | 29               | 38             |
Definition
{
  id: 'section-2',
  display: 'Data quality scorecards with RAG colous',
  description: '',
  visualisation: [
    {
      id: 'simple-scorecard-MetricTwo',
      type: 'scorecard',
      display: 'No of prisoners with MetricTwo',
      option: {
        useRagColour: true
      },
      column: {
        key: [{ id: 'est_id' }],
        measure: [{ id: 'has_metric_two' }],
      },
    },
    {
      id: 'simple-scorecard-MetricOne',
      type: 'scorecard',
      display: 'No of prisoners with MetricOne',
      option: {
        useRagColour: true
      },
      column: {
        key: [{ id: 'est_id' }],
        measure: [{ id: 'has_metric_one' }],
      },
    },
    {
      id: 'simple-scorecard-MetricThree',
      type: 'scorecard',
      display: 'No of prisoners with MetricThree',
      description: 'Example definition description',
      option: {
        useRagColour: true
      },
      column: {
        key: [{ id: 'est_id' }],
        measure: [{ id: 'has_metric_three' }],
      },
    },
  ],
},
see here for more info on targeting data
Visualisation
Custom bucket colours
Define custom colours to your buckets:
- Defines 3 buckets with custom
hexColourvalues that define the bucket colour. - Example sssumes that the dataset contains a rag score through a scoring engine.
Dataset
| ts         | est_id | has_metric_two | has_metric_three | has_metric_one |
|------------|--------|----------------|------------------|----------------|
| Jun 25.    | ABC    | 70             | 30               | 60             |
| Jul 25.    | ABC    | 80             | 34               | 80             |
| Aug 25.    | ABC    | 56             | 67               | 30             |
| Sep 25     | ABC    | 30             | 56               | 67             |
| Oct 25.    | ABC    | 42             | 43               | 42             |
| Nov 25.    | ABC    | 98             | 13               | 51             |
Definition
{
  id: 'section-2',
  display: 'Data quality scorecards with RAG colous',
  description: '',
  visualisation: [
    {
      id: 'simple-scorecard-MetricTwo',
      type: 'scorecard',
      display: 'No of prisoners with MetricTwo',
      option: {
        bucket: [
          { hexColour: '#912b88' },
          { hexColour: '#28a197' },
          { hexColour: '#f47738' }
        ],
      },
      column: {
        key: [{ id: 'est_id' }],
        measure: [{ id: 'has_metric_two' }],
      },
    },
    {
      id: 'simple-scorecard-MetricOne',
      type: 'scorecard',
      display: 'No of prisoners with MetricOne',
      option: {
        bucket: [
          { hexColour: '#912b88' },
          { hexColour: '#28a197' },
          { hexColour: '#f47738' }
        ],
      },
      column: {
        key: [{ id: 'est_id' }],
        measure: [{ id: 'has_metric_one' }],
      },
    },
    {
      id: 'simple-scorecard-MetricThree',
      type: 'scorecard',
      display: 'No of prisoners with MetricThree',
      option: {
        bucket: [
          { hexColour: '#912b88' },
          { hexColour: '#28a197' },
          { hexColour: '#f47738' }
        ],
      },
      column: {
        key: [{ id: 'est_id' }],
        measure: [{ id: 'has_metric_three' }],
      },
    },
  ],
},
see here for more info on targeting data
Visualisation
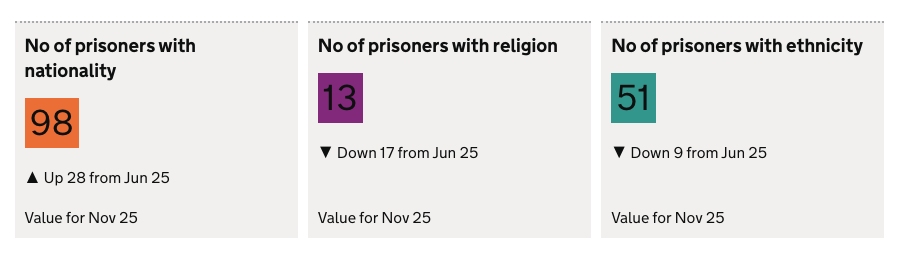
Custom buckets
In this example custom buckets are defined in the definition to set the RAG scores for the scorecard value
Dataset
| ts         | est_id | has_metric_two | has_metric_three | has_metric_one |
|------------|--------|----------------|------------------|----------------|
| Jun 25.    | ABC    | 70             | 30               | 60             |
| Jul 25.    | ABC    | 80             | 34               | 80             |
| Aug 25.    | ABC    | 56             | 67               | 30             |
| Sep 25     | ABC    | 30             | 56               | 67             |
| Oct 25.    | ABC    | 42             | 43               | 42             |
| Nov 25.    | ABC    | 98             | 13               | 51             |
Definition
{
  id: 'section-2',
  display: 'Data quality scorecards with RAG colous',
  description: '',
  visualisation: [
    {
      id: 'simple-scorecard-MetricTwo',
      type: 'scorecard',
      display: 'No of prisoners with MetricTwo',
      option: {
        useRagColour: true,
        bucket: [
          { max: 40 },
          { min: 41, max: 60 },
          { min: 61 }
        ],
      },
      column: {
        key: [{ id: 'est_id' }],
        measure: [{ id: 'has_metric_two' }],
      },
    },
    {
      id: 'simple-scorecard-MetricOne',
      type: 'scorecard',
      display: 'No of prisoners with MetricOne',
      option: {
        useRagColour: true,
        bucket: [
          { max: 50 },
          { min: 51, max: 55 },
          { min: 56 }
        ],
      },
      column: {
        key: [{ id: 'est_id' }],
        measure: [{ id: 'has_metric_one' }],
      },
    },
    {
      id: 'simple-scorecard-MetricThree',
      type: 'scorecard',
      display: 'No of prisoners with MetricThree',
      option: {
        useRagColour: true,
        bucket: [
          { max: 20 },
          { min: 21, max: 70 },
          { min: 71 }
        ],
      },
      column: {
        key: [{ id: 'est_id' }],
        measure: [{ id: 'has_metric_three' }],
      },
    },
  ],
},
See Custom buckets for documentation on defining custom buckets. see here for more info on targeting data.
Visualisation