Visualisation definition Line timeseries chart
The line-timeseries chart visualisation type represents data as a line chart showing historic data.
When to use
Use a line‑timeseries chart when you need to show how a value changes over time. This chart type emphasizes trends, cycles, seasonality, and long‑term movement, making it ideal for temporal datasets.
Choose a line‑timeseries chart when:
- Your data represents values over time (e.g., days, weeks, months, years).
- You want to highlight temporal trends, such as growth, decline, volatility, or periodic patterns.
- Time order is crucial, and the spacing or frequency of data points matters.
- You’re comparing multiple time‑based series, such as performance metrics or daily counts.
- You have many data points, and other chart types would become cluttered.
Use a line‑timeseries chart when helping users understand how something evolves or behaves through time.
When not to use
Avoid using a line‑timeseries chart when:
- The data isn’t related to time — use a standard line chart or another type entirely.
- Time intervals are inconsistent or categorical (e.g., “Phase 1, Phase 2”), which breaks the assumption of temporal continuity.
- You need to compare single points in time rather than trends — a bar or column chart works better.
- Your dataset has only a couple of timestamps, not enough to show a meaningful trend.
- You’re dealing with non‑continuous or event‑based timelines, where a dot plot, scatter, or bar chart may be clearer.
- Precision on individual values matters more than overall trend, as line charts can obscure exact readings.
How it works
- Line‑timeseries charts detect partial time periods (e.g., the first or last month in a range that isn’t a full month).
- Partial periods are shown with a dotted line to distinguish them from complete data.
- This indicates that these values don’t represent a full time unit at the chosen granularity.
- Standard line charts don’t handle partial dates, so all points appear as fully complete.
Definition
{
  id: 'id',
  type: 'line-timeseries',
  display: 'name',
  description: 'description',
  column: {
    ...
  }
}
See the Targeting data for and how to target data with the column
Data assumptions
- The dataset must include a column with the ID
ts, containing timestamp values. - The
tsvalues should already be formatted exactly as you want them displayed — the visualisation will render them as‑is without additional formatting.
Examples
Example Dataset
| Date   | est_id | no_metric_one  | no_metric_two  | no_metric_three  |
|--------|--------|----------------|----------------|------------------|
| Aug 24 | ABC    | 781            | 754            | 802              |
| Aug 24 | GHI    | 610            | 589            | 633              |
| Aug 24 | DEF    | 499            | 472            | 518              |
| Sep 24 | ABC    | 514            | 538            | 497              |
| Sep 24 | GHI    | 518            | 492            | 531              |
| Sep 24 | DEF    | 521            | 549            | 505              |
| Oct 24 | ABC    | 598            | 612            | 580              |
| Oct 24 | GHI    | 676            | 702            | 661              |
| Oct 24 | DEF    | 687            | 655            | 712              |
| Nov 24 | ABC    | 522            | 499            | 548              |
| Nov 24 | GHI    | 790            | 768            | 812              |
| Nov 24 | DEF    | 713            | 689            | 727              |
| Dec 24 | ABC    | 431            | 452            | 408              |
| Dec 24 | GHI    | 536            | 522            | 561              |
| Dec 24 | DEF    | 590            | 574            | 613              |
| Jan 25 | ABC    | 614            | 643            | 609              |
| Jan 25 | GHI    | 713            | 695            | 740              |
| Jan 25 | DEF    | 682            | 668            | 701              |
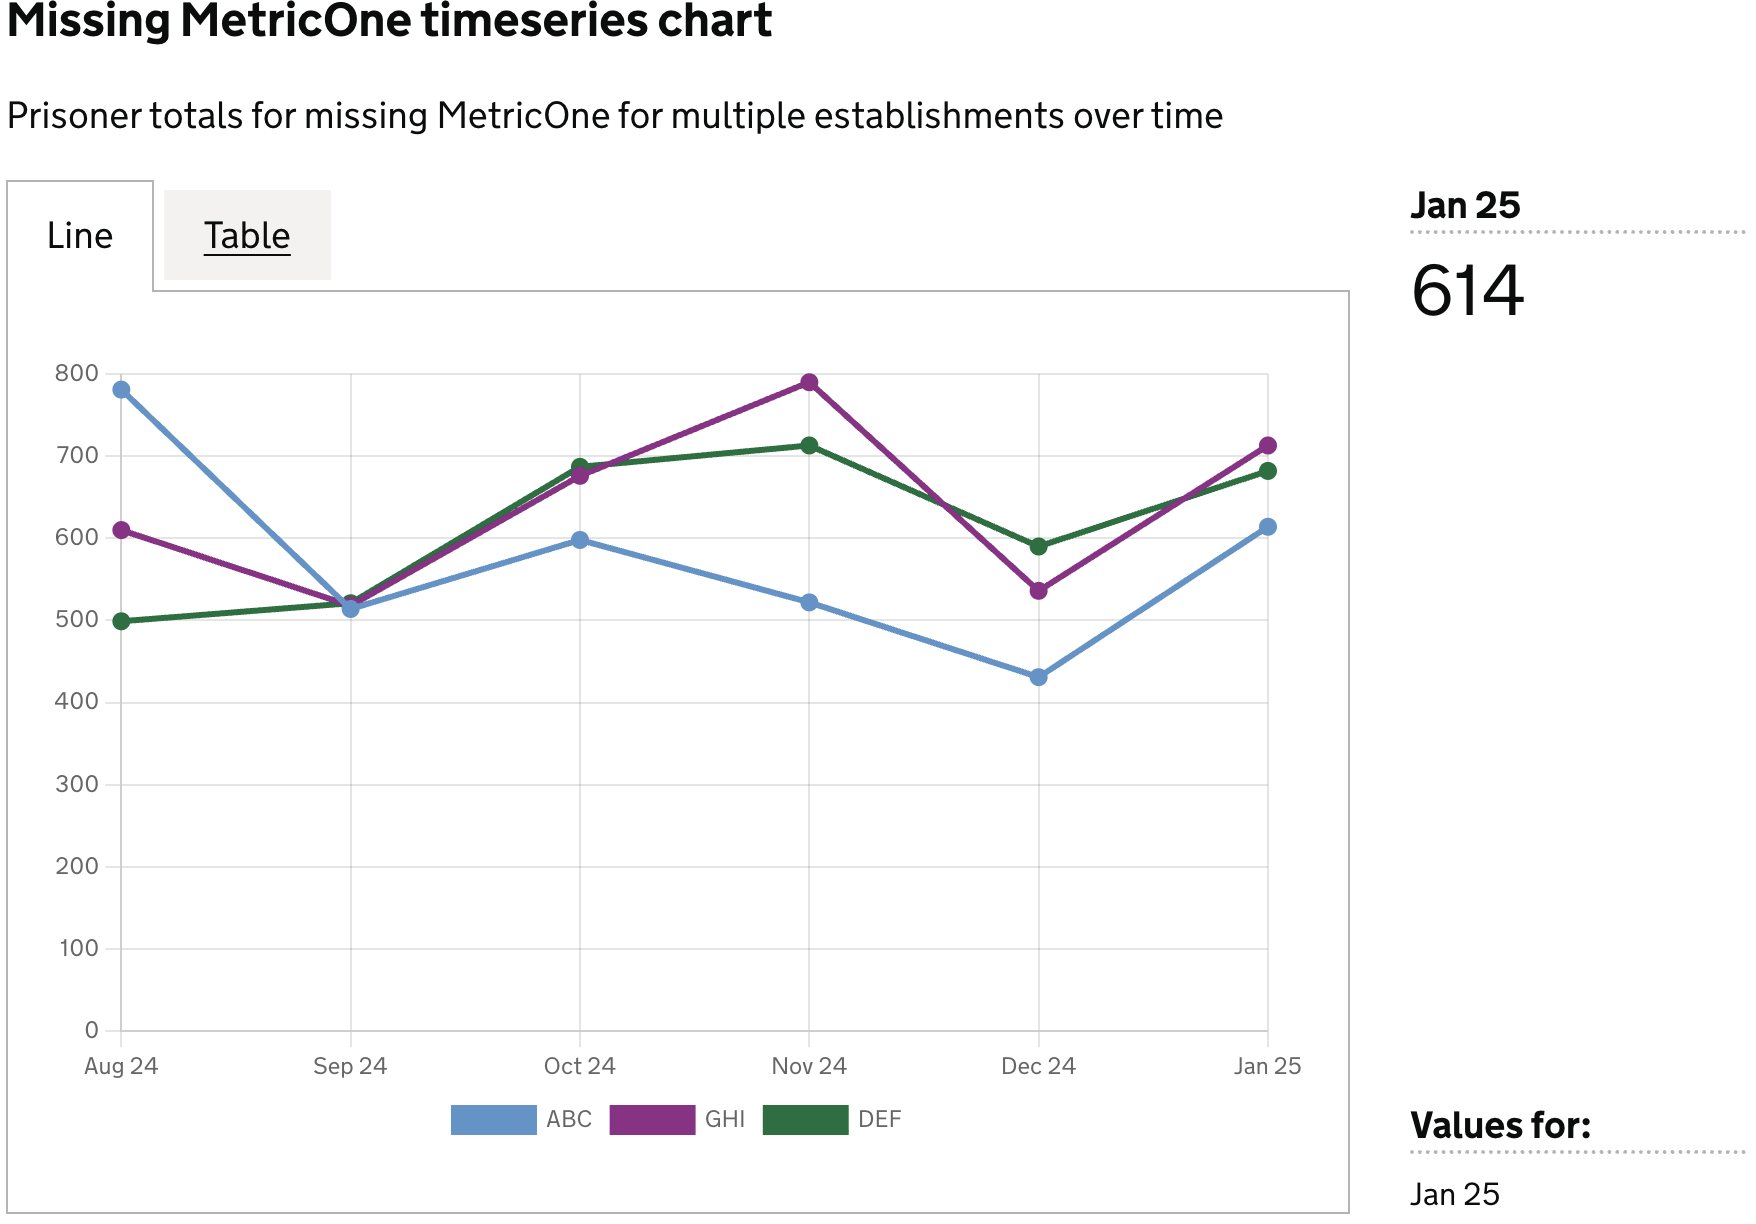
Example 1
Prisoner totals for missing MetricOne by establishment over time
Definition
{
  id: 'mockMetricOneLineChartTimeseries',
  type: 'line-timeseries',
  display: 'Missing MetricOne timeseries chart',
  description: 'Prisoner totals for missing MetricOne by establishment over time',
  columns: {
    keys: [
      {
        id: 'establishment_id',
        display: 'Establishment ID',
      },
    ],
    measures: [
      {
        id: 'ts',
        display: 'Date',
      },
      {
        id: 'no_metric_one',
        display: 'Has no MetricOne',
      },
    ],
    expectNulls: false,
  },
}
Visualisation dataset
This definition will return the following dataset
| ts     | est_id | no_metric_one  |
|--------|--------|----------------|
| Aug 24 | ABC    | 781            |
| Aug 24 | GHI    | 610            |
| Aug 24 | DEF    | 499            |
| Sep 24 | ABC    | 514            |
| Sep 24 | GHI    | 518            |
| Sep 24 | DEF    | 521            |
| Oct 24 | ABC    | 598            |
| Oct 24 | GHI    | 676            |
| Oct 24 | DEF    | 687            |
| Nov 24 | ABC    | 522            |
| Nov 24 | GHI    | 790            |
| Nov 24 | DEF    | 713            |
| Dec 24 | ABC    | 431            |
| Dec 24 | GHI    | 536            |
| Dec 24 | DEF    | 590            |
| Jan 25 | ABC    | 614            |
| Jan 25 | GHI    | 713            |
| Jan 25 | DEF    | 682            |
see here for more info on targeting data
Visualisation
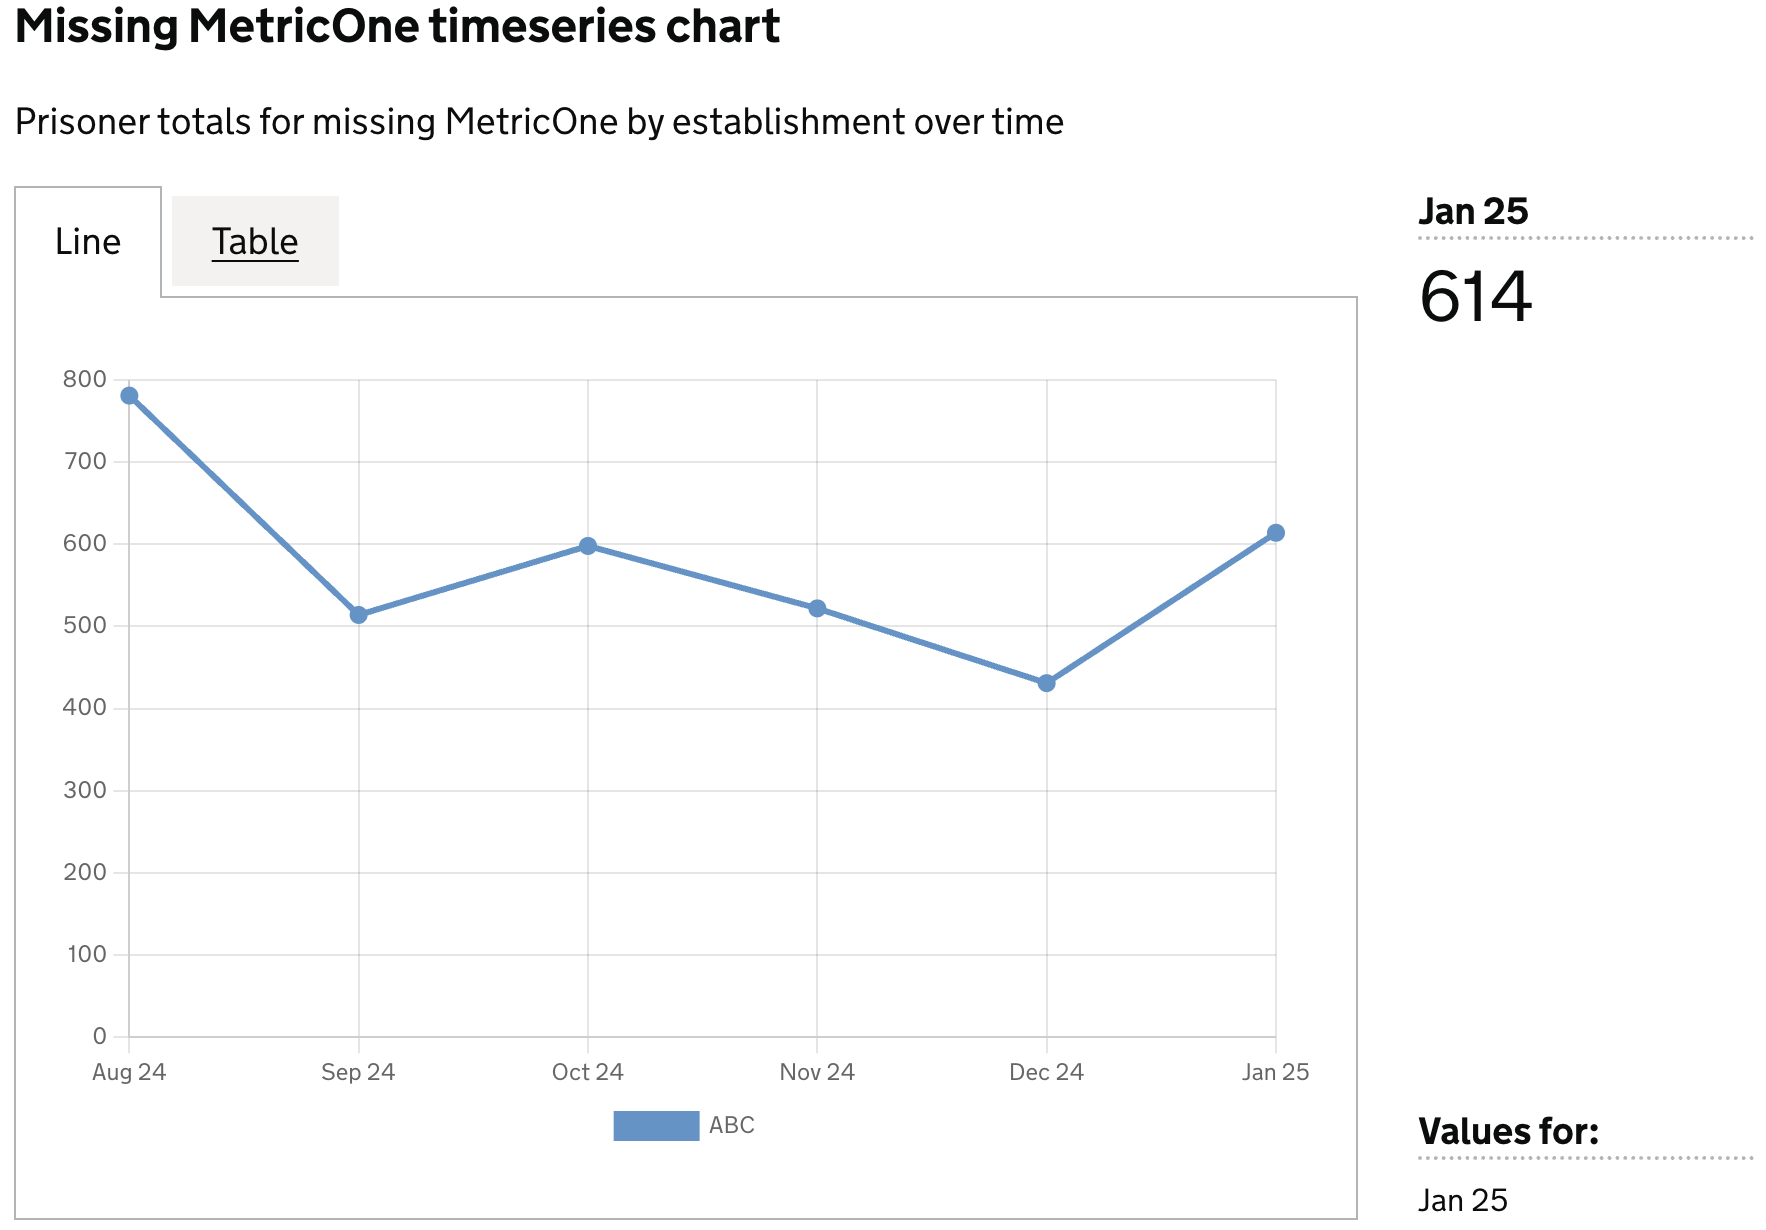
Example 2
Prisoner totals for missing MetricOne by single establishment over time, using filters
Definition
{
  id: 'mockMetricOneLineChartTimeseries',
  type: 'line-timeseries',
  display: 'Missing MetricOne timeseries chart',
  description: 'Prisoner totals for missing MetricOne by establishment over time',
  columns: {
    keys: [
      {
        id: 'establishment_id',
        display: 'Establishment ID',
      },
    ],
    measures: [
      {
        id: 'ts',
        display: 'Date',
      },
      {
        id: 'no_metric_one',
        display: 'Has no MetricOne',
      },
    ],
    filters: [
      {
        id: 'establishment_id',
        equals: 'ABC',
      },
    ],
    expectNulls: false,
  },
}
Visualisation dataset
This definition will return the following dataset
| ts     | est_id | no_metric_one  |
|--------|--------|----------------|
| Aug 24 | ABC    | 781            |
| Sep 24 | ABC    | 514            |
| Oct 24 | ABC    | 598            |
| Nov 24 | ABC    | 522            |
| Dec 24 | ABC    | 431            |
| Jan 25 | ABC    | 614            |
see here for more info on targeting data
Visualisation