Visualisation definition Doughnut chart
The doughnut chart visualisation type represents data as a matrix/heatmap chart visualisation.
When to use
Use a pie chart when you want to show how individual categories contribute to a single whole. Pie charts work best when the goal is to communicate proportions, share, or relative distribution at a glance. Choose a pie chart when:
- Your data represents parts of a whole, and the total is meaningful (e.g., 100%, total revenue, total population).
- You have a small number of categories — ideally 3–5 — so each slice is easy to distinguish.
- You want to highlight the largest or smallest contributors in a dataset.
- The general proportion matters more than precise comparison, as pies emphasize broad shares rather than exact values.
- You need a simple, visual snapshot of how something is divided.
Pie charts are especially effective when clarity of overall composition is more important than detailed numerical comparison.
When not to use
Avoid using a pie chart when:
- You need to compare values precisely — pie slices make exact comparisons difficult; bar charts are clearer.
- There are many categories or slices — anything above 5–6 segments becomes cluttered and hard to read.
- The values are similar in size, making slice differences nearly impossible to distinguish.
- You want to show changes over time — use a line or bar chart instead of multiple pie charts.
- Negative values are present, as pie charts can only represent positive proportions of a whole.
- The data doesn’t sum to a meaningful whole (e.g., independent metrics) — a pie chart implies parts of a single total.
- Your categories don’t represent parts of a whole, but stand‑alone values better shown in a bar chart.
- You need to compare multiple datasets — pie charts don’t scale well for side‑by‑side comparison.
- Order matters, such as progression or ranking — pie charts don’t convey sequence.
Definition
{
  id: 'id',
  type: 'doughnut',
  display: 'name',
  description: 'description',
  column: {
    ...
  }
}
See the Targeting data for and how to target data with the column
Examples
Example Dataset
| ts     | est_id | has_metric_one | no_metric_one | has_metric_two | no_metric_two | has_metric_three | no_metric_three |
|--------|--------|----------------|---------------|----------------|---------------|------------------|-----------------|
| Jan 25 | ABC    | 533            | 614           | 684            | 665           | 680              | 799             |
| Jan 25 | GHI    | 484            | 713           | 700            | 506           | 771              | 457             |
| Jan 25 | DEF    | 406            | 682           | 703            | 409           | 648              | 720             |
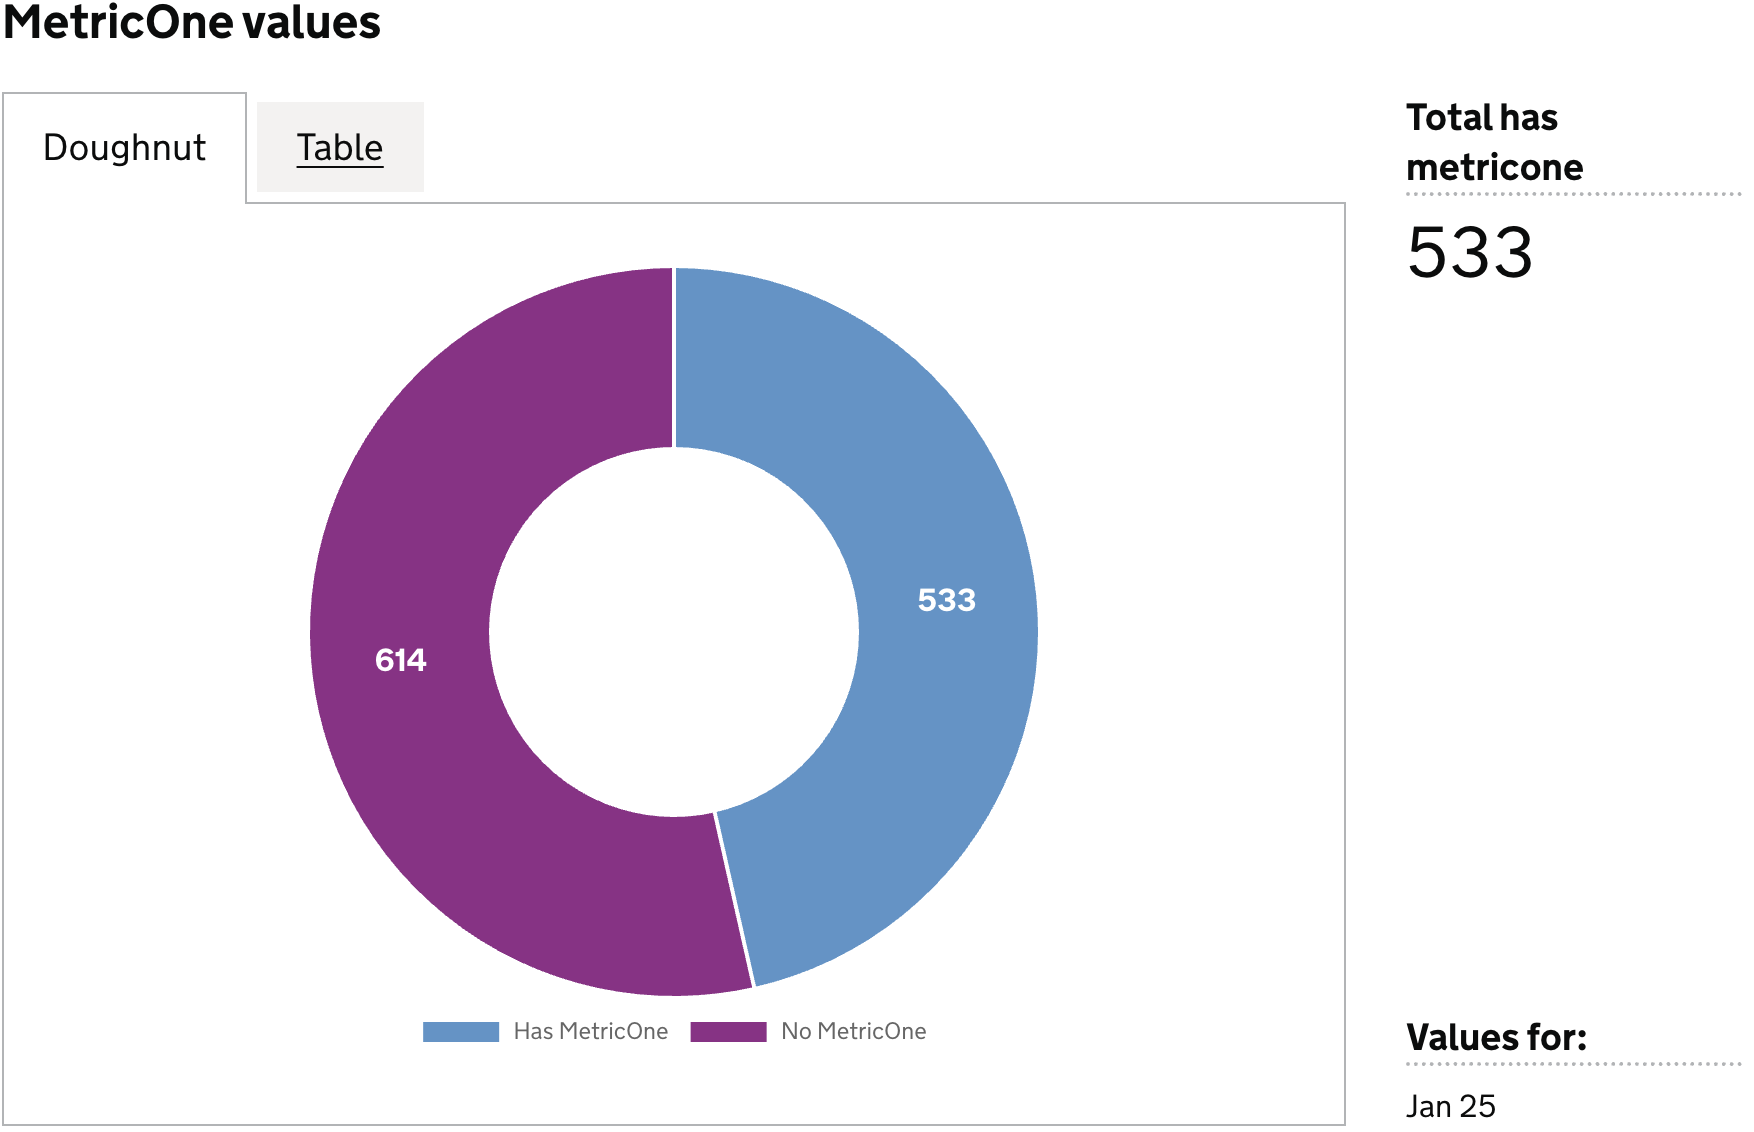
Example 1
Definition
{
  id: 'doughnut-data-quality-has-MetricOne',
  type: 'doughnut',
  display: 'MetricOne values',
  columns: {
    keys: [
      {
        id: 'establishment_id',
        display: 'Establishment ID',
      },
    ],
    measures: [
      {
        id: 'has_metric_one',
        display: 'Has MetricOne',
      },
      {
        id: 'no_metric_one',
        display: 'No MetricOne',
      },
    ],
    filters: [
      {
        id: 'establishment_id',
        equals: 'ABC',
      },
    ],
    expectNulls: false,
  },
}
Visualisation dataset
This definition will return the following dataset
| ts     | est_id | has_metric_one | no_metric_one |
|--------|--------|----------------|---------------|
| Jan 25 | ABC    | 533            | 614           |
see here for more info on targeting data
Visualisation
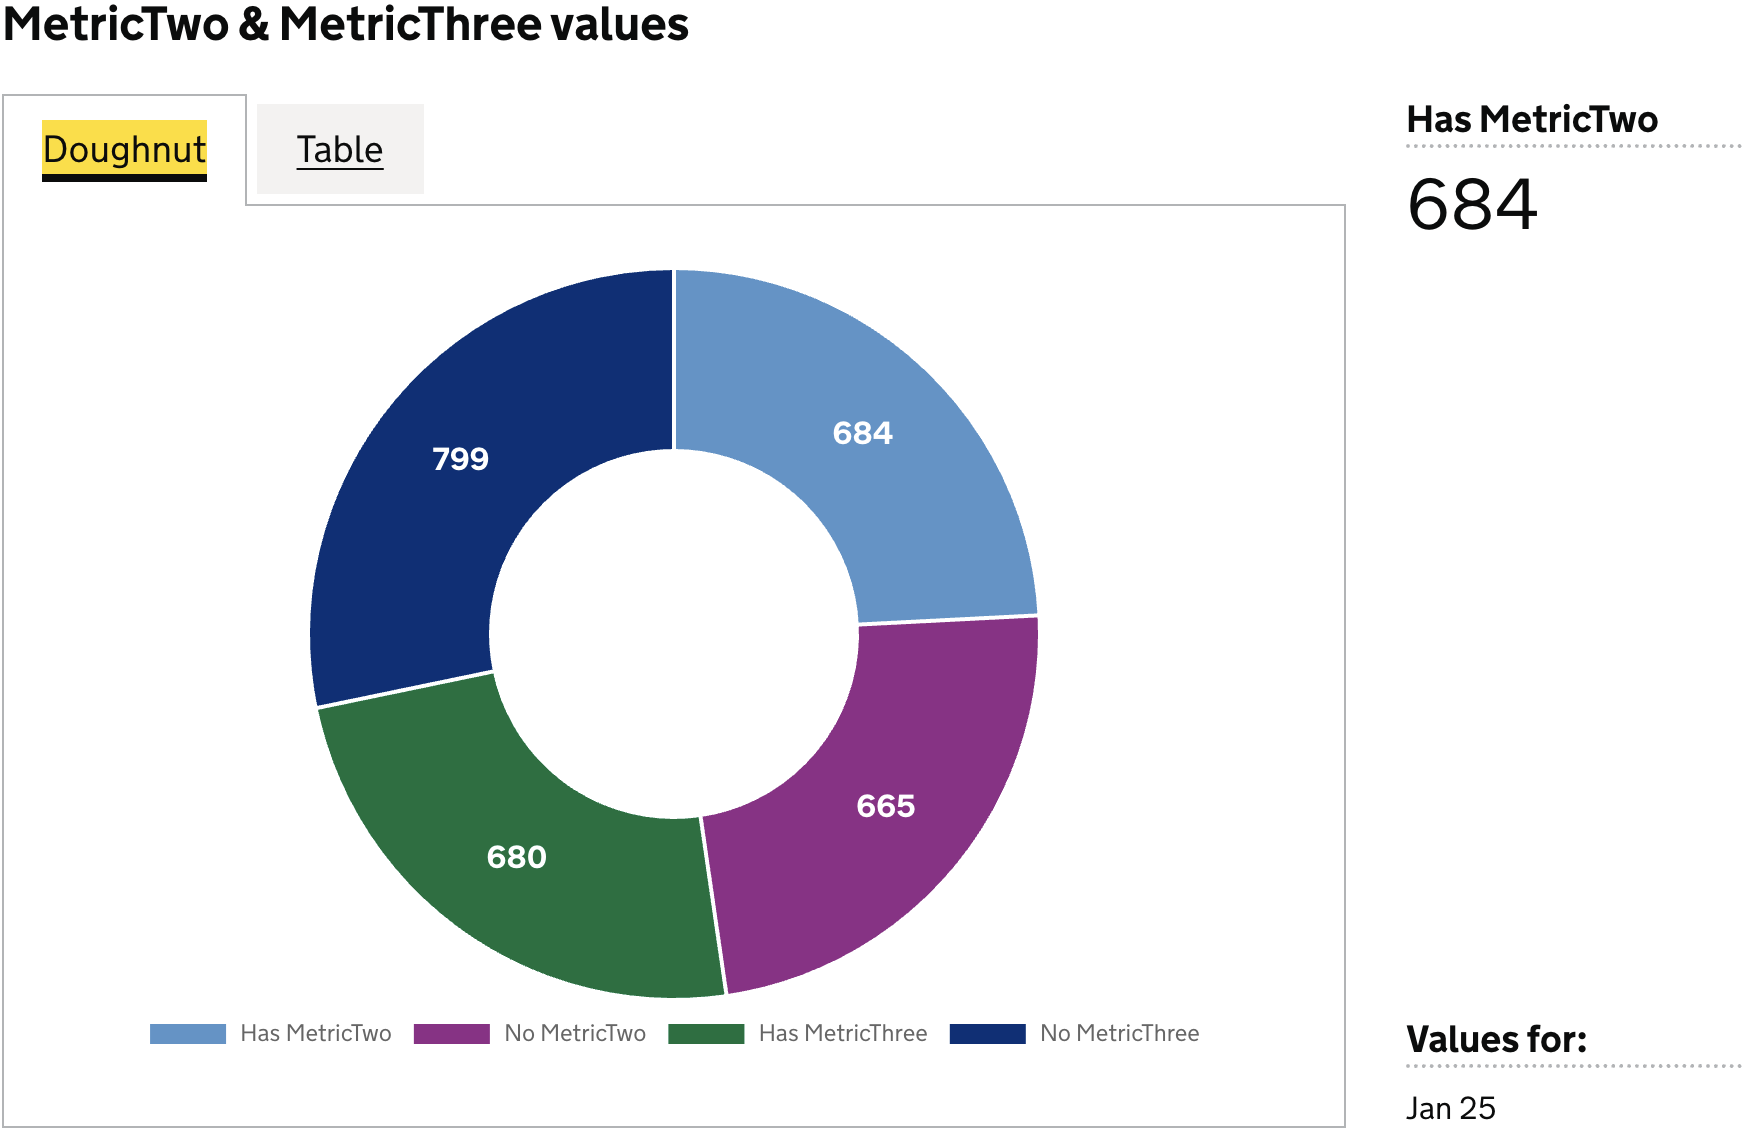
Example 2
Definition
{
  id: 'doughnut-data-quality-has-MetricTwo-MetricThree',
  type: 'doughnut',
  display: 'MetricTwo & MetricThree values',
  columns: {
    keys: [
      {
        id: 'est_id',
        display: 'Establishment ID',
      },
    ],
    measures: [
      {
        id: 'has_metric_two',
        display: 'Has MetricTwo',
      },
      {
        id: 'no_metric_two',
        display: 'No MetricTwo',
      },
      {
        id: 'has_metric_three',
        display: 'Has MetricThree',
      },
      {
        id: 'no_metric_three',
        display: 'No MetricThree',
      },
    ],
    filters: [
      {
        id: 'establishment_id',
        equals: 'ABC',
      },
    ],
    expectNulls: false,
  },
}
Visualisation dataset
This definition will return the following dataset
| ts     | est_id | has_metric_two | no_metric_two | has_metric_three | no_metric_three |
|--------|--------|----------------|---------------|------------------|-----------------|
| Jan 25 | ABC    | 684            | 665           | 680              | 799             |
see here for more info on targeting data
Visualisation
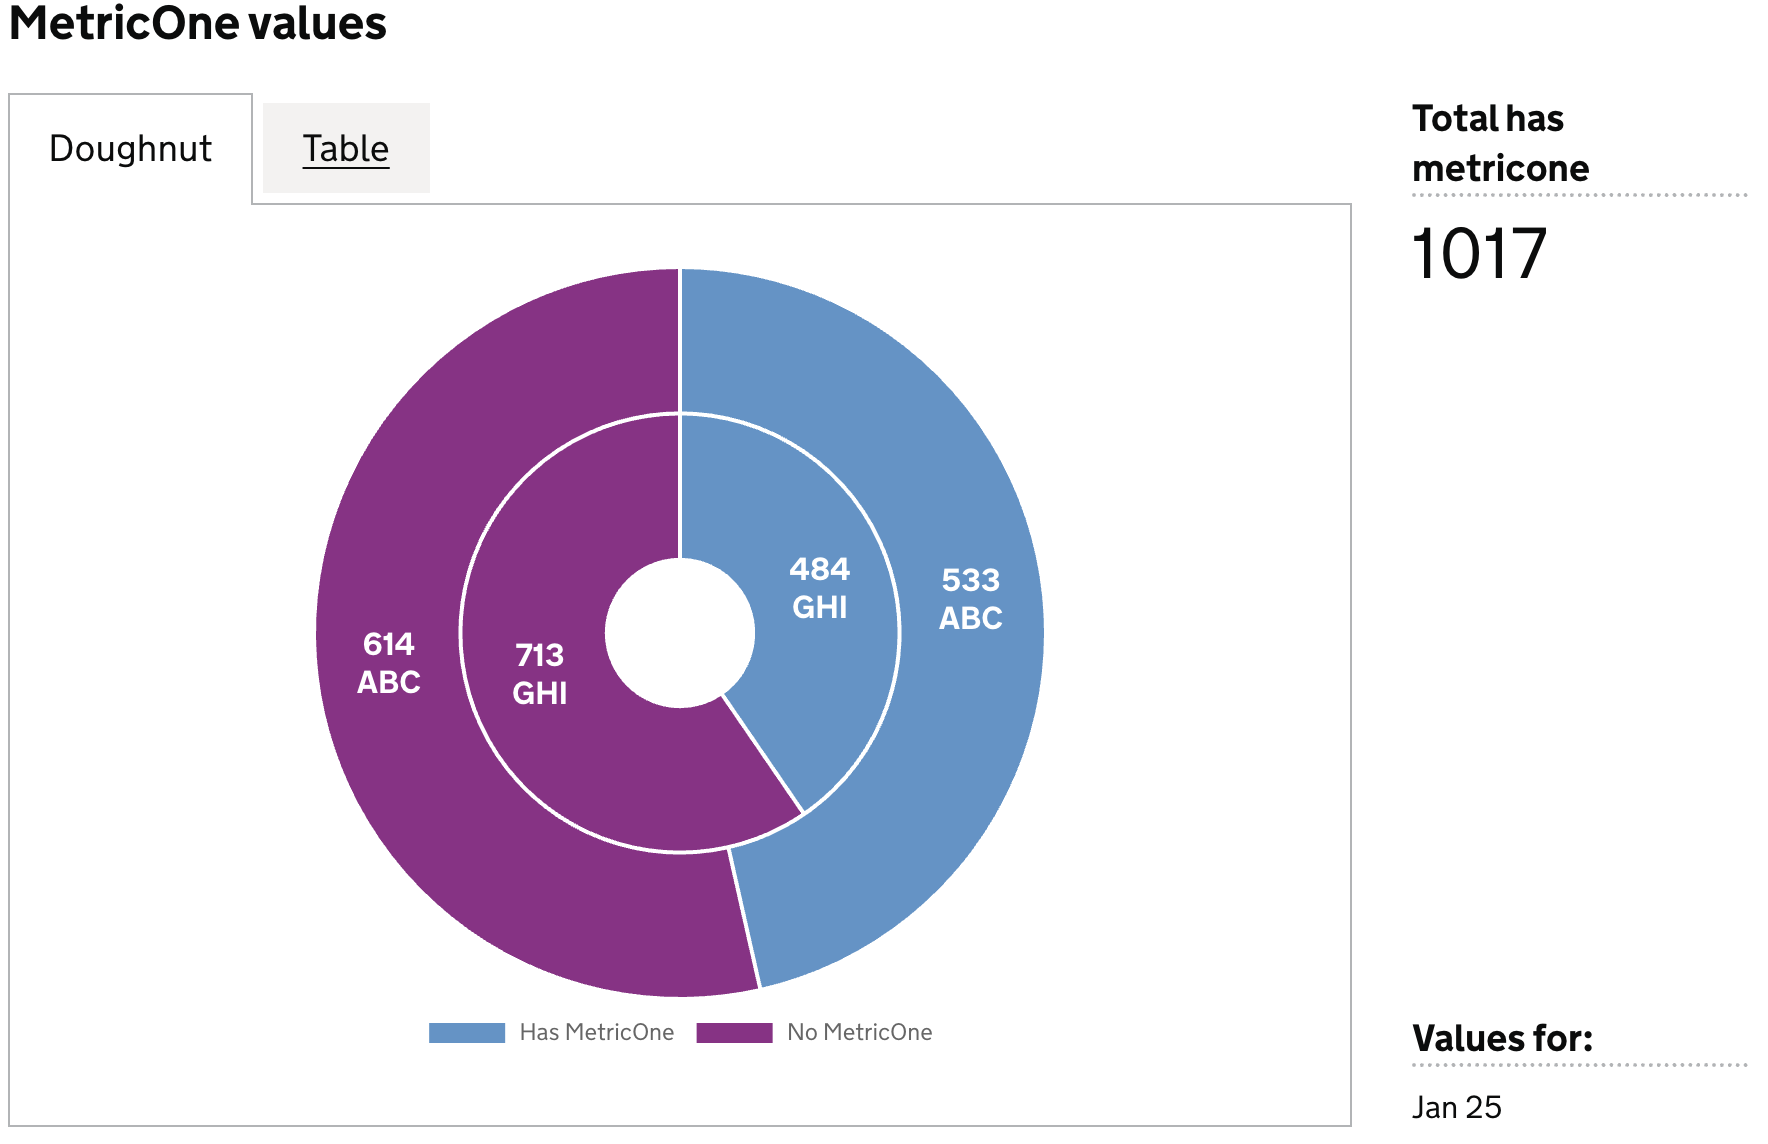
Example 3
Definition
{
  id: 'doughnut-data-quality-has-MetricOne-two-ring',
  type: 'doughnut',
  display: 'MetricOne values',
  columns: {
    keys: [
      {
        id: 'est_id',
        display: 'Establishment ID',
      },
    ],
    measures: [
      {
        id: 'has_metric_one',
        display: 'Has MetricOne',
      },
      {
        id: 'no_metric_one',
        display: 'No MetricOne',
      },
    ],
    filters: [
      {
        id: 'establishment_id',
        equals: 'ABC',
      },
      {
        id: 'establishment_id',
        equals: 'GHI',
      },
    ],
    expectNulls: false,
  },
}
Visualisation dataset
This definition will return the following dataset
| est_id | has_metric_one  | no_metric_one  |
|--------|-----------------|----------------|
| ABC    | 533             | 614            |
| GHI    | 484             | 713            |
see here for more info on targeting data
Visualisation