Visualisation definition Scorecard Group
The scorecard-group chart visualisation type represents data as a collection scorecard visualisations in a group.
A scorecard is used to display:
- A snapshot value of a data point at a specific point in time.
- The data trend over time, within a user selected date range.
- The RAG score/status for the presented value.
contents
When to use
Use scorecard group when:
- You want to display a group of scorecards
- You want multiple rows in a data subset displayed as scorecards
How it works
A scorecard group uses multiple rows in a dataset to create the visualisation.
A scorecard group can be generated from a list, or from columns defined in a dataset. See the examples below for instruction in how to do this.
See the scorecard for details on how a scorecard works
Definition
{
  id: 'scorecard-group-definition-example',
  type: 'scorecard-group',
  display: 'Scorecard Group title',
  description: 'scorecard-group visualisation description',
  option: {
    ...
  }
  column: {
    ...
  }
}
See the Targeting data for and how to target data with the column
Options:
See Custom buckets for options documentation
Examples
These examples demonstrate how to present multiple rows within a dataset as a scorecard group.
Example Dataset
For these examples we will use a mocked dataset representing data quality totals.
| ts         | est_id | has_metric_two | has_metric_one | has_metric_three | metric_three_is_missing |
|------------|--------|----------------|----------------|------------------|-------------------------|
| Nov 25.    | ABC    | 21             | 91             | 54               | 63                      |
| Nov 25.    | DEF    | 34             | 21             | 12               | 12                      |
| Nov 25.    | JKL    | 23             | 63             | 87               | 54                      |
| Nov 25.    | GHI    | 86             | 64             | 36               | 87                      |
... omitted past ts data
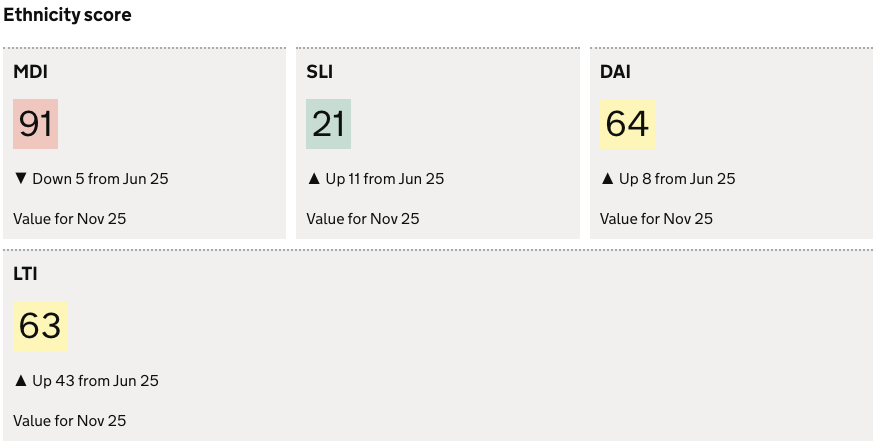
Scorecard group from list data
The example creates a scorecard group using values in a list. We will be showing MetricOne metrics by establishment ID.
To do this we define 2 measures
- the column we want to use as the list:
est_id - the column we want to use as the numeric value:
has_metric_one
We must also define displayValue in the measure for the numeric value:
- Informs which column the numeric value should be taken from, and which is the description column.
- instructs that the group is to be generated from a list
In this dataset we have 4 unique values for est_id, therefore we will have 4 scorecards in our group
Definition
{
  id: 'data-quality-MetricOne',
  type: 'scorecard-group',
  display: 'MetricOne score',
  description: '',
  option: {
    useRagColour: true,
    bucket: [{ min: 0, max: 500 }, { min: 501, max: 700 }, { min: 701 }],
  },
  column: {
    key: [{ id: 'establishment_id' }],
    measure: [
      {
        id: 'establishment_id',       // defines the value to use as the scorecard title
        display: ''                   // optional prefix display value
      },
      {
        id: 'has_metric_one',
        displayValue: true,           // defines the number value to display, that that this is a group from a list
      },
    ],
  },
}
Visualisation
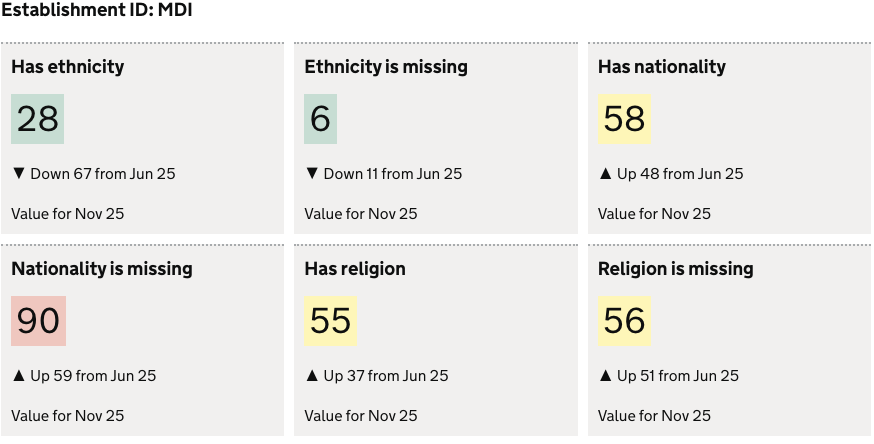
Scorecard group from columns
This example demonstrates how to create a scorecard group using columns in a dataset as scorecard titles and values. The example shows data quality metrics as a group for each establishment
- Define all columns in the
measurearray that you want display, with adisplayfield to add the scorecard title - Define the column(s) in the
keyarray that we want to group by.
Each value in the group column will be used as new group:
est_idis defined as our groupest_idhas 6 unique values in the dataset- therefore we will have 6 groups - One for each value.
Definition
{
  id: 'data-quality-no-MetricTwo',
  type: 'scorecard-group',
  display: 'Data quality scores',
  description: '',
  option: {
    bucket: [{ min: 0, max: 500 }, { min: 501, max: 700 }, { min: 701 }],
    useRagColour: true,
  },
  column: {
    key: [
      {
        id: 'est_id',
        display: 'Establishment ID',
      },
    ],
    measure: [
      {
        id: 'has_metric_two',
        display: 'Has MetricTwo',
      },
      {
        id: 'metric_two_is_missing',
        display: 'MetricTwo is missing',
      },
      {
        id: 'metric_three_is_missing',
        display: 'MetricThree is missing',
      },
      {
        id: 'has_metric_three',
        display: 'Has MetricThree',
      },
      {
        id: 'metric_one_is_missing',
        display: 'MetricOne is missing',
      },
      {
        id: 'has_metric_one',
        display: 'Has MetricOne',
      },
    ],
  },
}
Visualisation