Visualisation definition Bar timeseries chart
🚧 This section is a work in progress 🚧
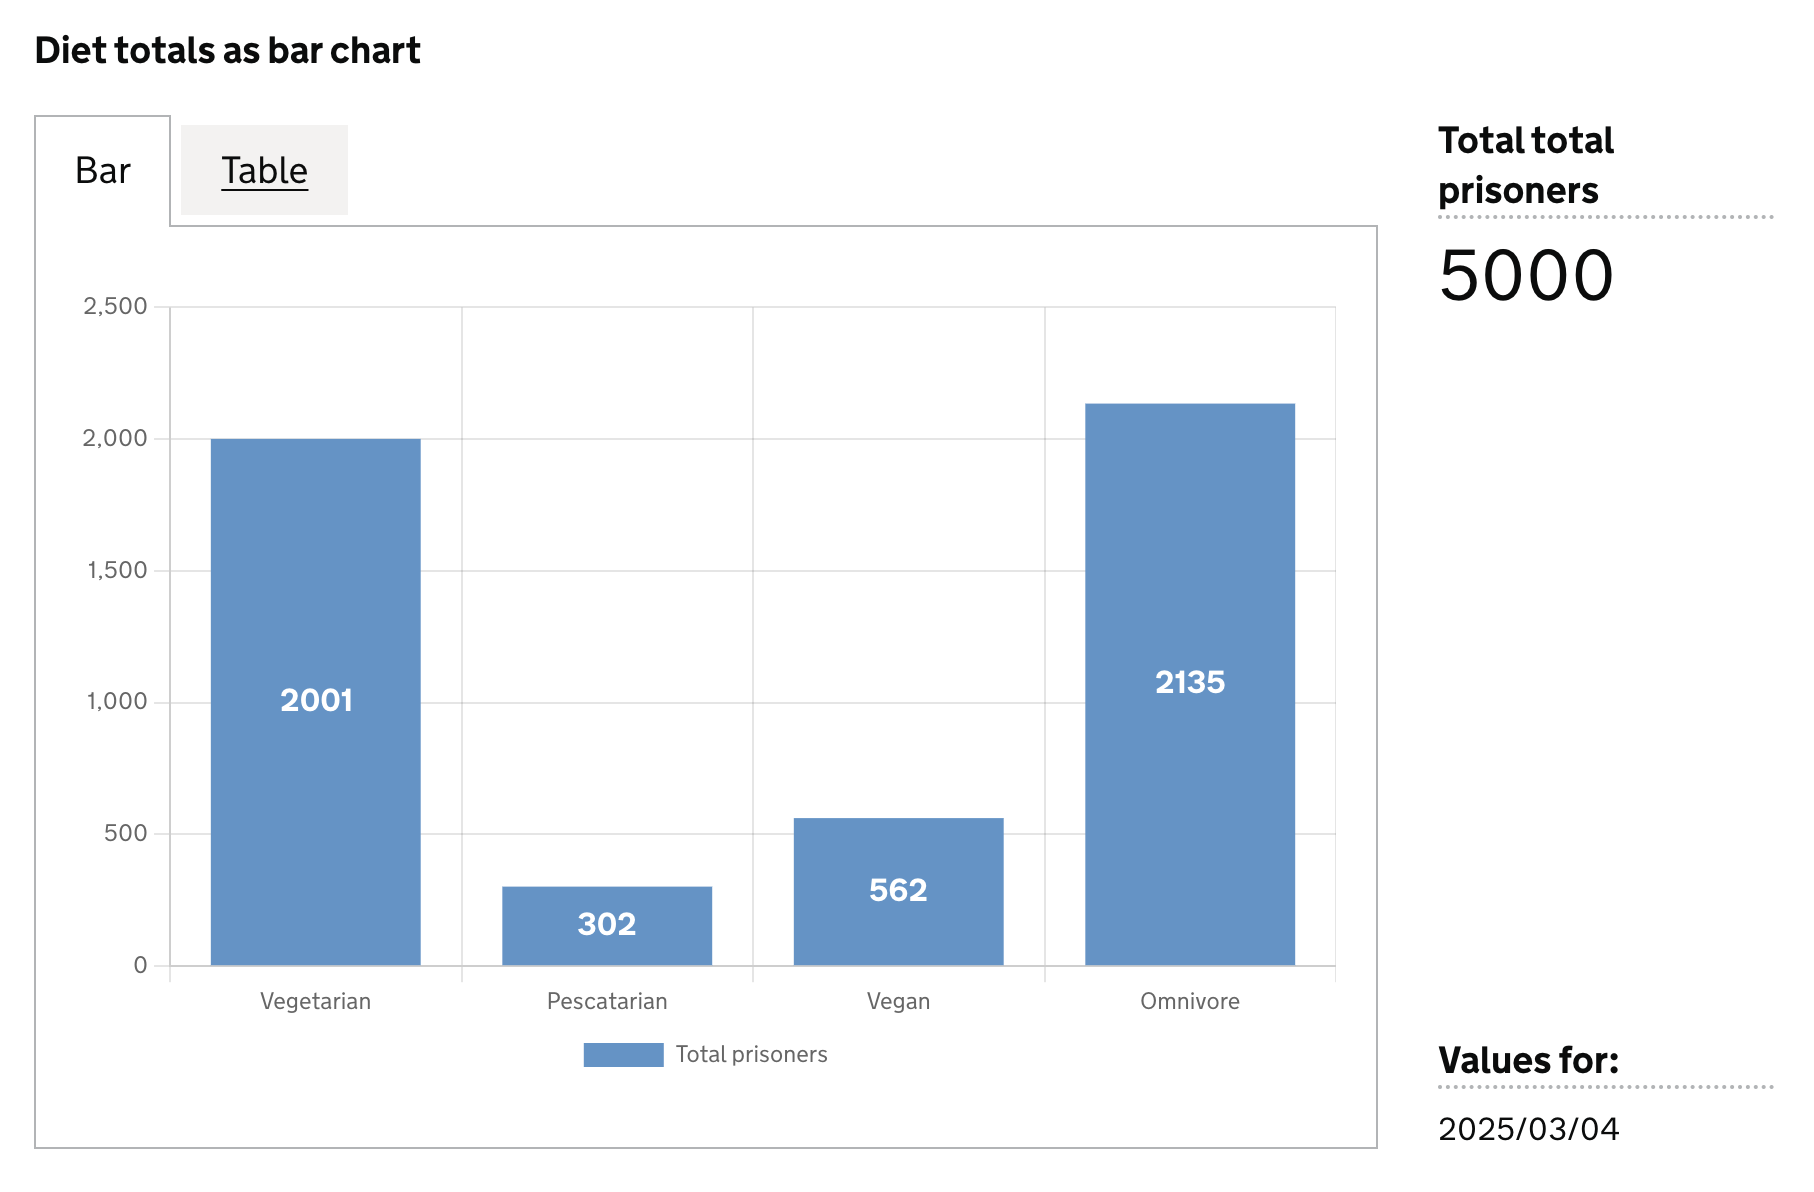
The bar-timeseries chart visualisation type represents data as a bar chart showing historic data.
When to use
TBD
How it works
TBD
Definition
{
  id: 'id',
  type: 'bar-timeseries',
  display: 'name',
  description: 'description',
  column: {
    ...
  }
}
See the Targeting data for and how to target data with the column
Examples
Example Dataset
| ts         |  est_id  | wing  | cell  | finds       | count |
|------------|----------| ------|-------|-------------|-------|
| 2025/02/25 |          |       |       |             | 81    |
| 2025/02/25 |          |       |       | Drugs       | 17    |
| 2025/02/25 |          |       |       | Phones      | 22    |
| 2025/02/25 |          |       |       | Weapons     | 26    |
| 2025/02/25 |          |       |       | Alcohol     | 16    |
Example 1
TBD
Definition
{
  id: 'example-1',
  type: 'vis-type',
  display: 'Example definition',
  description: 'Example definition description',
  option: {},
  column: {
    key: [],
    measure: [],
    filter: []
    expectNull: true,
  },
}
Visualisation dataset
This definition will return the following dataset
see here for more info on targeting data
Visualisation
Example 2
TBD
Definition
{
  id: 'example-1',
  type: 'vis-type',
  display: 'Example definition',
  description: 'Example definition description',
  option: {},
  column: {
    key: [],
    measure: [],
    filter: []
    expectNull: true,
  },
}
Visualisation dataset
This definition will return the following dataset
see here for more info on targeting data
Visualisation
