Visualisation definition Bar chart
The bar chart visualisation type represents data as a bar chart visualisation.
Charts are accompanied by a table/list representation of the underlying chart data.
When to use
Use this visualisation type when you need to display data as a bar chart.
Definition
{
  id: 'bar-definition-example',
  type: 'bar',
  display: 'bar title',
  description: 'bar visualisation description',
  columns: {
    ...
  }
}
To learn more about defining the data for the visualisation using the columns field see here
Examples
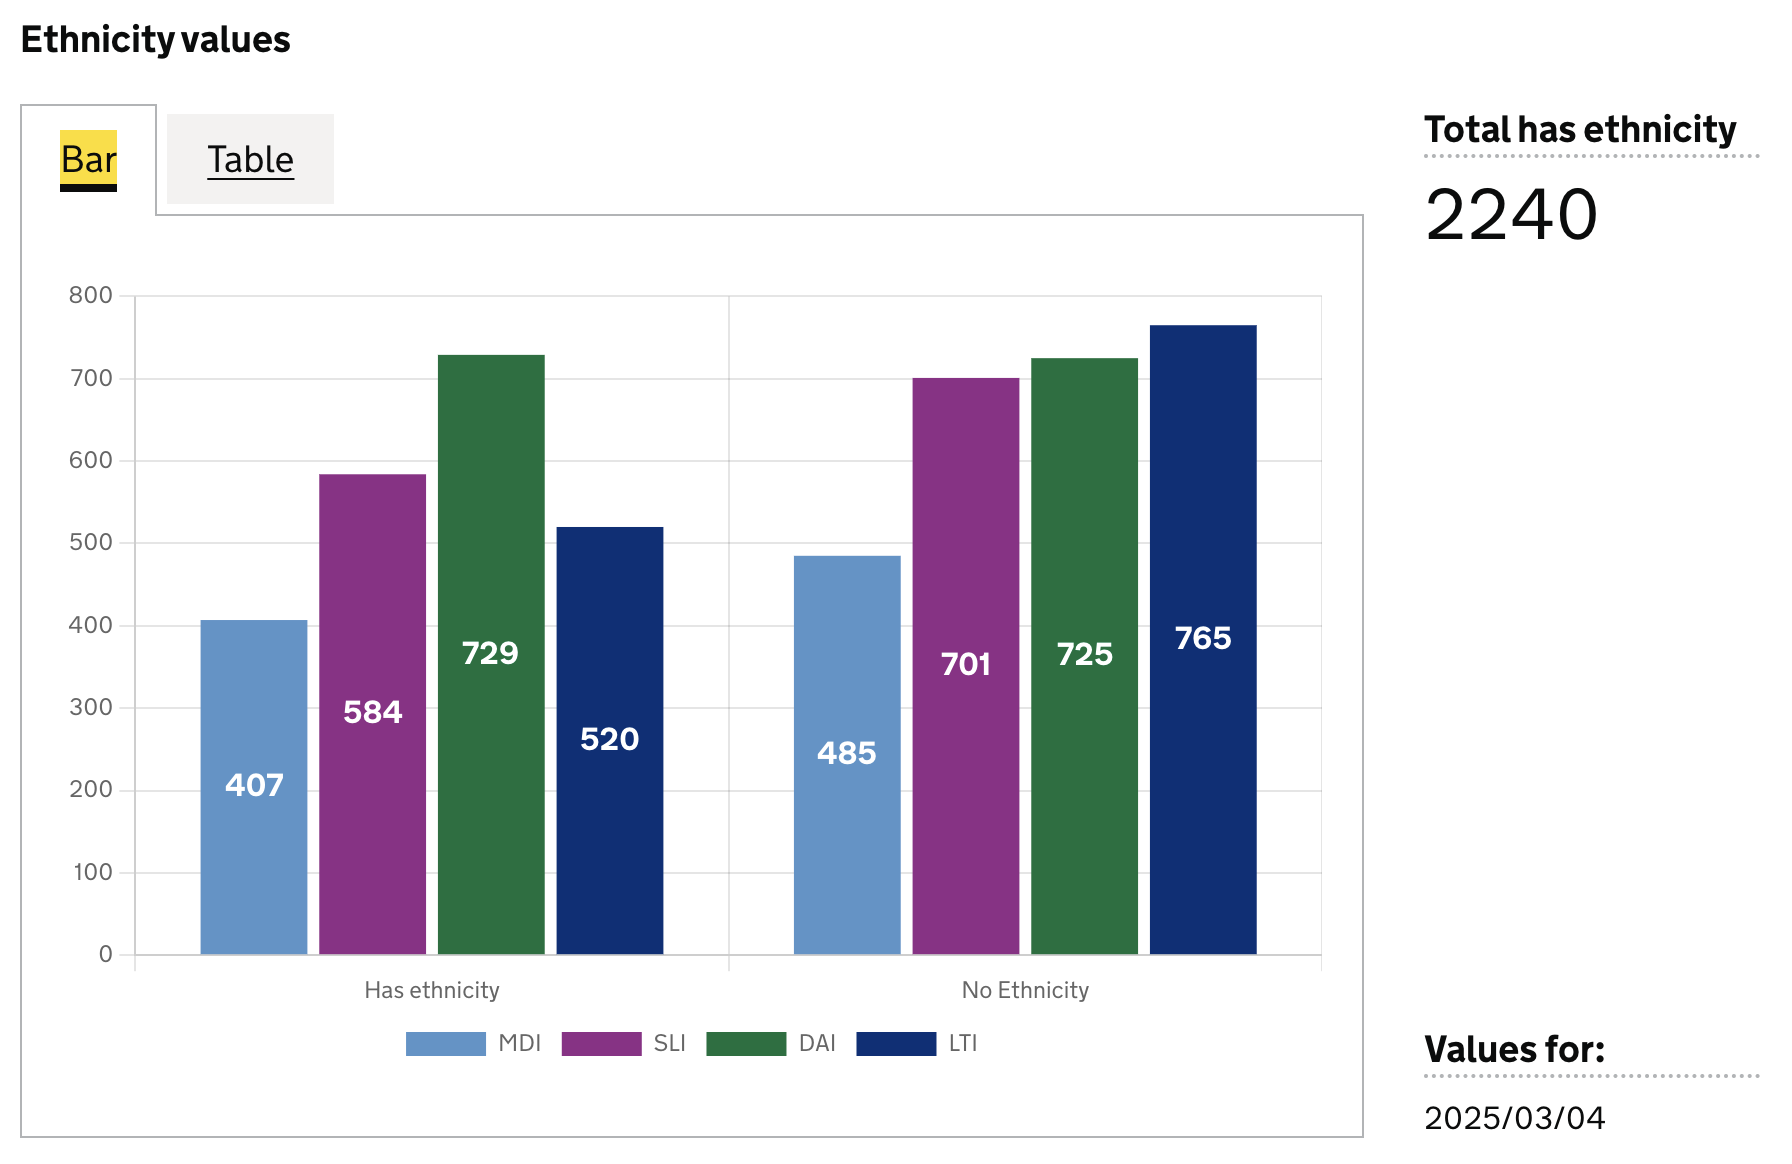
Define dataset columns as bar labels
In this example we will define which dataset columns to use in the bar chart as follows:
- each column will be new bar in the chart
- the column value will be represented as the size of the bar
- each row will be a new dataset in the chart
For example, given we have a dashboard dataset like this:
| est_id | has_ethnicity | ethnicity_is_missing | has_religion | religion_is_missing |
|--------|---------------|----------------------|--------------|---------------------|
| MDI    | 407           | 485                  | 300          | 500                 |
| SLI    | 584           | 701                  | 280          | 320                 |
| LTI    | 729           | 725                  | 220          | 214                 |
| DAI    | 520           | 765                  | 220          | 214                 |
and a definition as follows:
{
  id: 'metric-bar-example',
  type: 'bar',
  display: 'Ethnicity values',
  description: '',
  columns: {
    keys: [
      {
        id: 'est_id',
        display: 'Establishment ID'
      }
    ],
    measures: [
      {
        id: 'has_ethnicity',
        display: 'Has ethnicity',
      },
      {
        id: 'ethnicity_is_missing',
        display: 'No ethnicity',
      },
    ],
  },
}
This definition will return the following dataset (see here for more info on targeting data):
| est_id | has_ethnicity | ethnicity_is_missing |
|--------|---------------|----------------------|
| MDI    | 407           | 485                  |
| SLI    | 584           | 701                  |
| LTI    | 729           | 725                  |
| DAI    | 520           | 765                  |
And produce this bar chart visualisation:
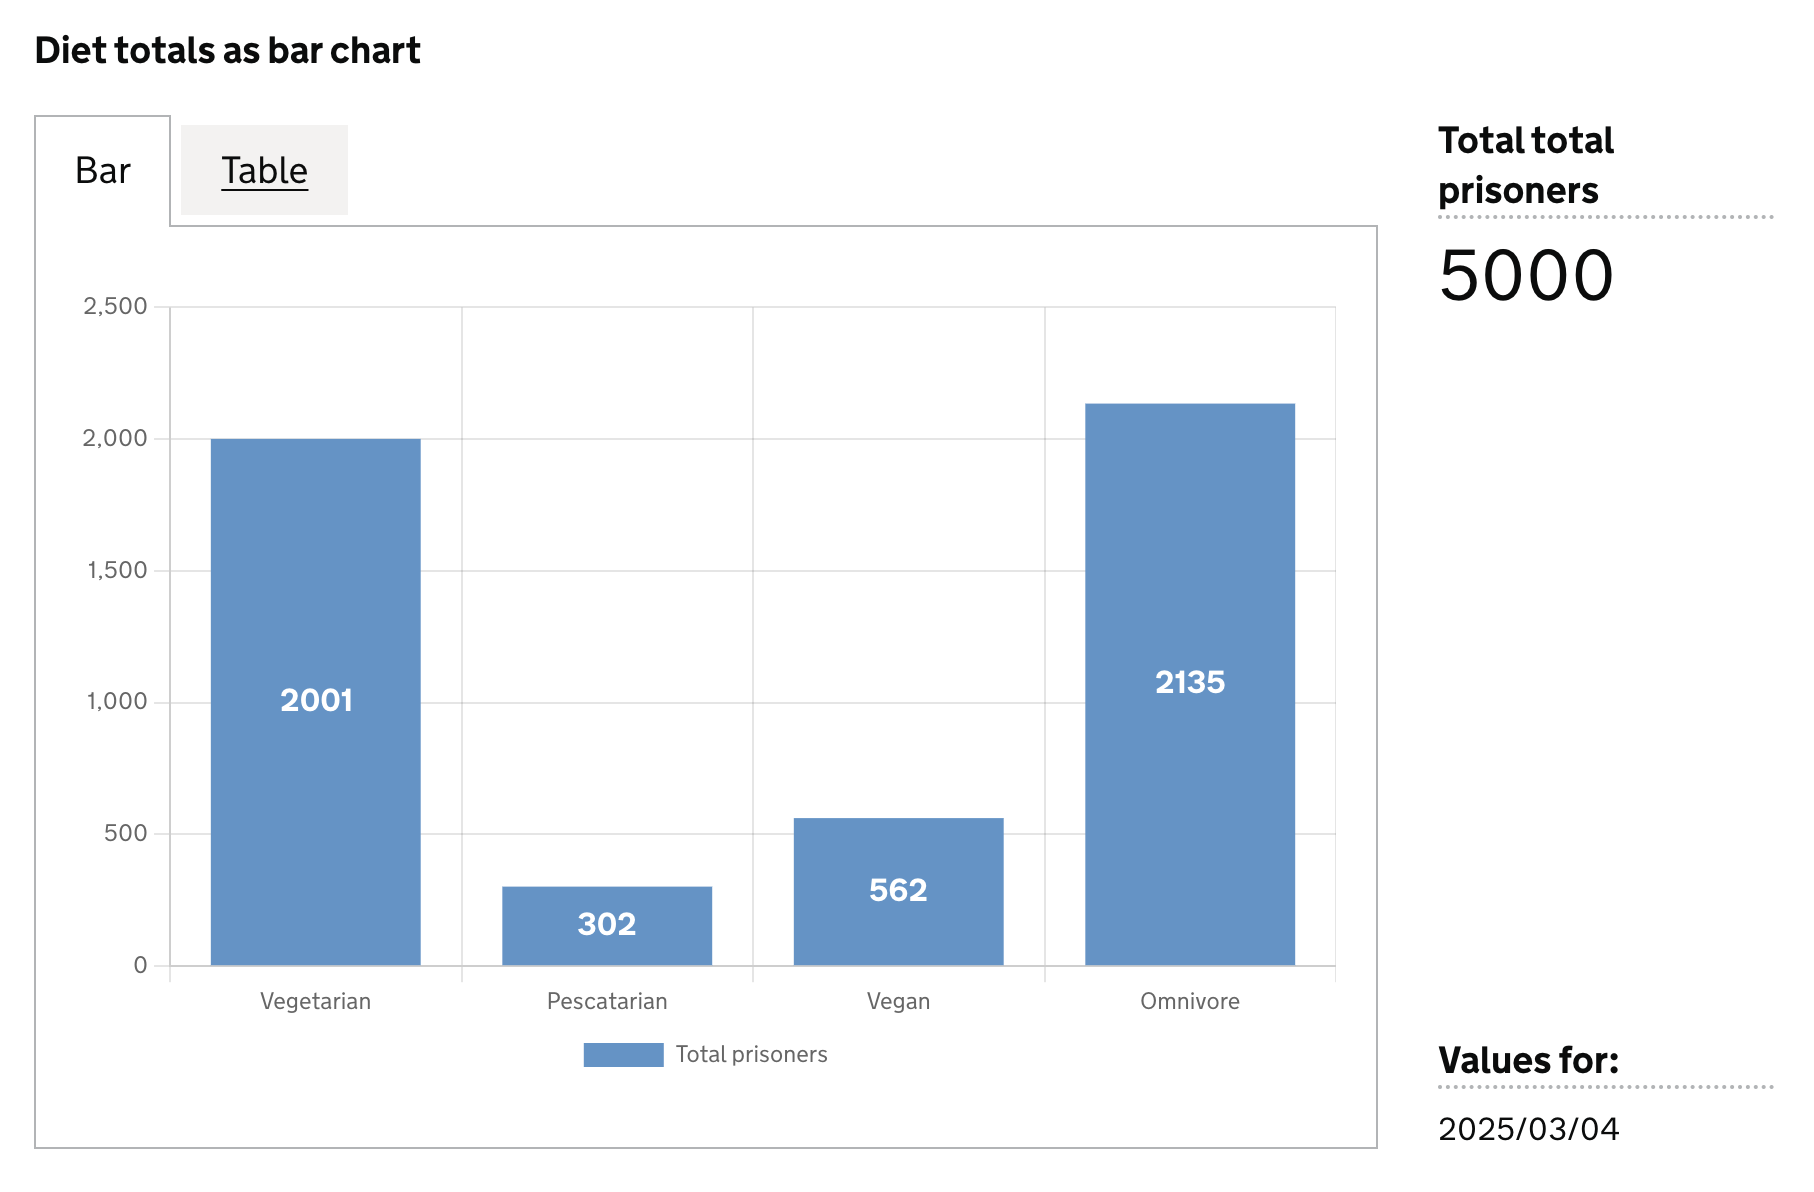
Dataset values as labels
In this example we will use values in a specific column for the bar labels, and use another column as the values for the bar.
Here we can define the axis field on the specific dataset columns we want to use for the labels (x), and their corresponding values (y)
For example, given we have a dashboard dataset like this:
| ts         |  est_id  | wing  | cell  | diet        | count |
|------------|----------| ------|-------|-------------|-------|
| 2025/02/25 |          |       |       |             | 5000  |
| 2025/02/25 | MDI      |       |       |             | 1109  |
| 2025/02/25 |          |       |       | vegetarian  | 1507  |
| 2025/02/25 |          |       |       | Pescatarian | 1130  |
| 2025/02/25 |          |       |       | Vegan       | 1354  |
| 2025/02/25 |          |       |       | Omnivore    | 1009  |
| 2025/02/25 | MDI      |       |       | vegetarian  | 169   |
| 2025/02/25 | MDI      |       |       | Pescatarian | 463   |
| 2025/02/25 | MDI      |       |       | Vegan       | 397   |
| 2025/02/25 | MDI      |       |       | Omnivore    | 80    |
and this definition:
{
  id: 'bar-diet-totals',
  type: 'bar',
  display: 'Diet totals as bar chart',
  description: '',
  columns: {
    keys: [],
    measures: [
      {
        id: 'diet',
        display: 'Diet',
        axis: 'x',    // <-- column whose values are used as bar labels
      },
      {
        id: 'count',
        display: 'Total prisoners',
        axis: 'y',    // <-- column whose values are used as the bar size
      },
    ],
    expectNulls: true,
  },
}
This definition will return the following dataset (see here for more info on targeting data).
| ts         |  est_id  | wing  | cell  | diet        | count |
|------------|----------| ------|-------|-------------|-------|
| 2025/02/25 |          |       |       | vegetarian  | 1507  |
| 2025/02/25 |          |       |       | Pescatarian | 1130  |
| 2025/02/25 |          |       |       | Vegan       | 1354  |
| 2025/02/25 |          |       |       | Omnivore    | 1009  |
to produce this bar chart.